

Are you tired of relying on guesswork to manage your inventory? Do you want to prevent shortages while minimizing excess inventory? Look no further! In addition to the popular ABC analysis, there’s another crucial process that can help you maintain optimal inventory levels—the XYZ analysis. Let’s dive into the details and uncover how it can revolutionize your inventory management strategy.
What is an XYZ analysis?
An XYZ analysis complements the ABC analysis by adding a statistical review of usage variation. It provides valuable insights into parts with steady usage and those with unpredictable demand. By categorizing goods into three groups—X items, Y items, and Z items—companies can make informed inventory decisions and determine order policies.
- X items have minimal demand variation, allowing for accurate demand forecasting.
- Y items experience fluctuating demand due to known factors such as seasons or economic changes.
- Z items have the highest demand variations, often caused by unknown factors or sudden changes in demand.
Based on these classifications, companies can establish optimal order schedules. X items should be ordered frequently, Y items less frequently, and Z items the least frequently due to their irregular and unpredictable demand.
Calculating demand variability
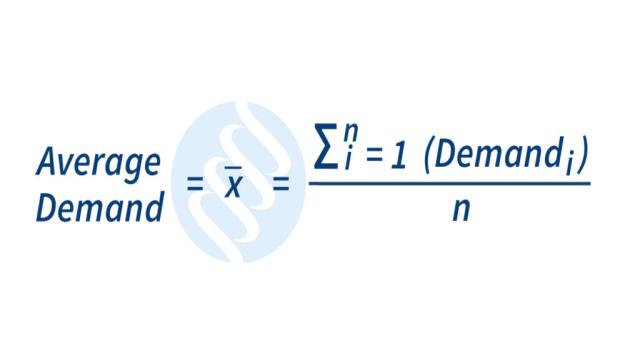
Demand variability is a crucial factor in the XYZ analysis. It helps determine how much demand fluctuates for a particular product or inventory item. To calculate demand variability, you need to find the average demand over a specific period and then calculate the difference between each data point and the average. Squaring the differences and finding the average squared deviation allows you to quantify demand variability.
The relationship between XYZ and ABC analyses
An XYZ analysis works hand in hand with an ABC analysis—they are complementary and cannot be substituted for one another. While an ABC analysis focuses on throughput cost, an XYZ analysis emphasizes variance in consumer demand. Together, they provide a comprehensive understanding of each product item and determine optimal order frequency to meet demand without creating excess inventory.
For instance, a part classified as both A and X indicates a high-cost part with steady usage. To minimize costs, it’s best to maintain minimal stock and order frequently. On the other hand, a part classified as both C and Z suggests a cheaper item with high demand variation. Although this may result in more obsolete parts, purchasing an appropriate stock minimizes working capital and carrying costs while accounting for unpredictable demand.
Automating the analyses
With historical company data, LeanDNA automates ABC-XYZ stock analysis reports and generates a comprehensive Plan for Every Part. By leveraging LeanDNA, you can swiftly determine ABC-XYZ classifications and put them into action, saving time and money in the process.
Put your XYZ analysis to good use
Remember, an analysis is only valuable if it is put into action! The reports generated from an ABC-XYZ analysis should be used to create your Plan for Every Part (PFEP). By implementing best practices and utilizing the insights gained from the analysis, you can optimize your inventory and reduce obsolescence.
Unlock the benefits of inventory optimization
Are you ready to experience the advantages of inventory optimization? Discover how Tony Gonzalez, the global lean supply chain manager at Electrical Components International (ECI), reduced critical shortages by an average of 30% across their sites within the first six months of implementing supply chain automation software.
Don’t miss out on ways to optimize your inventory—start your journey today!

